Operator Dashboard
The ROBIN Dashboard is a React-based operator interface at http://localhost:5174. It connects to the Alert Engine API and provides real-time monitoring, robot control, AI model management, and deviation alerting - all configurable per domain profile.
Live Ops
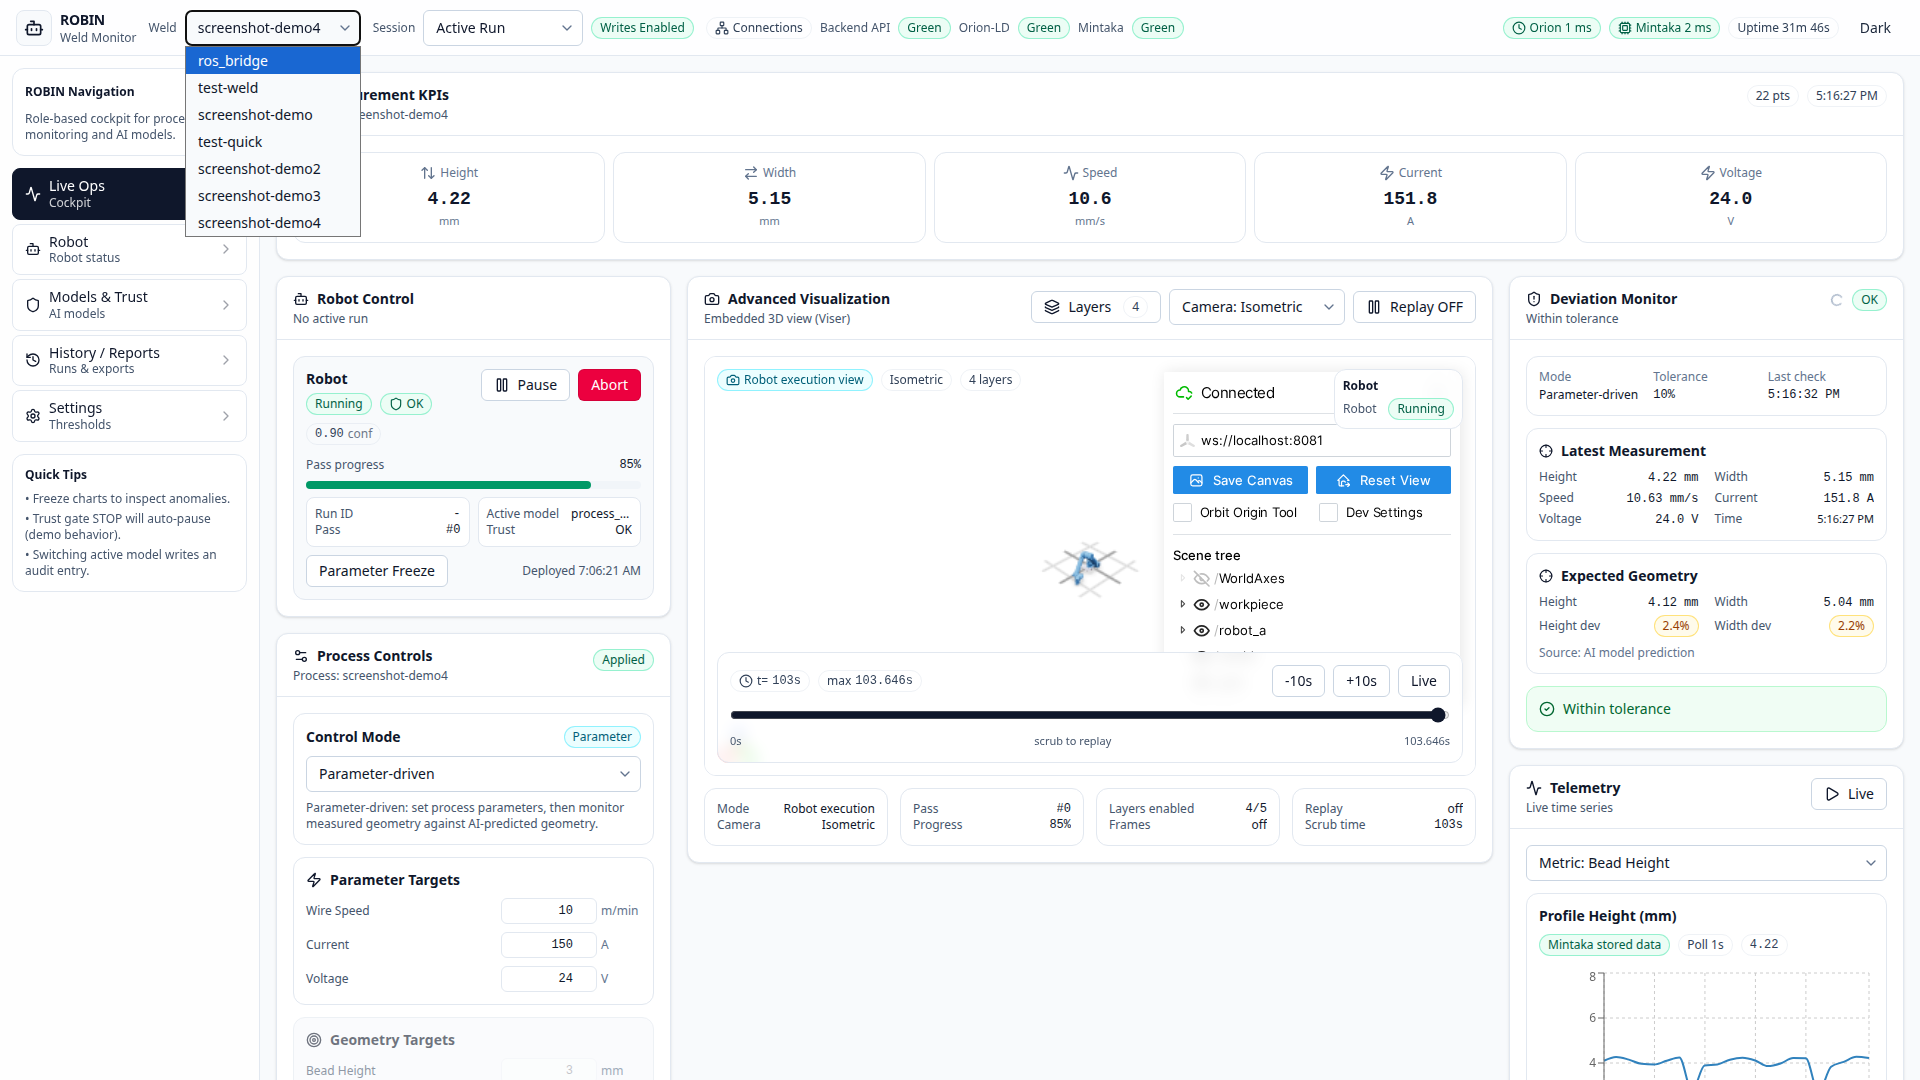
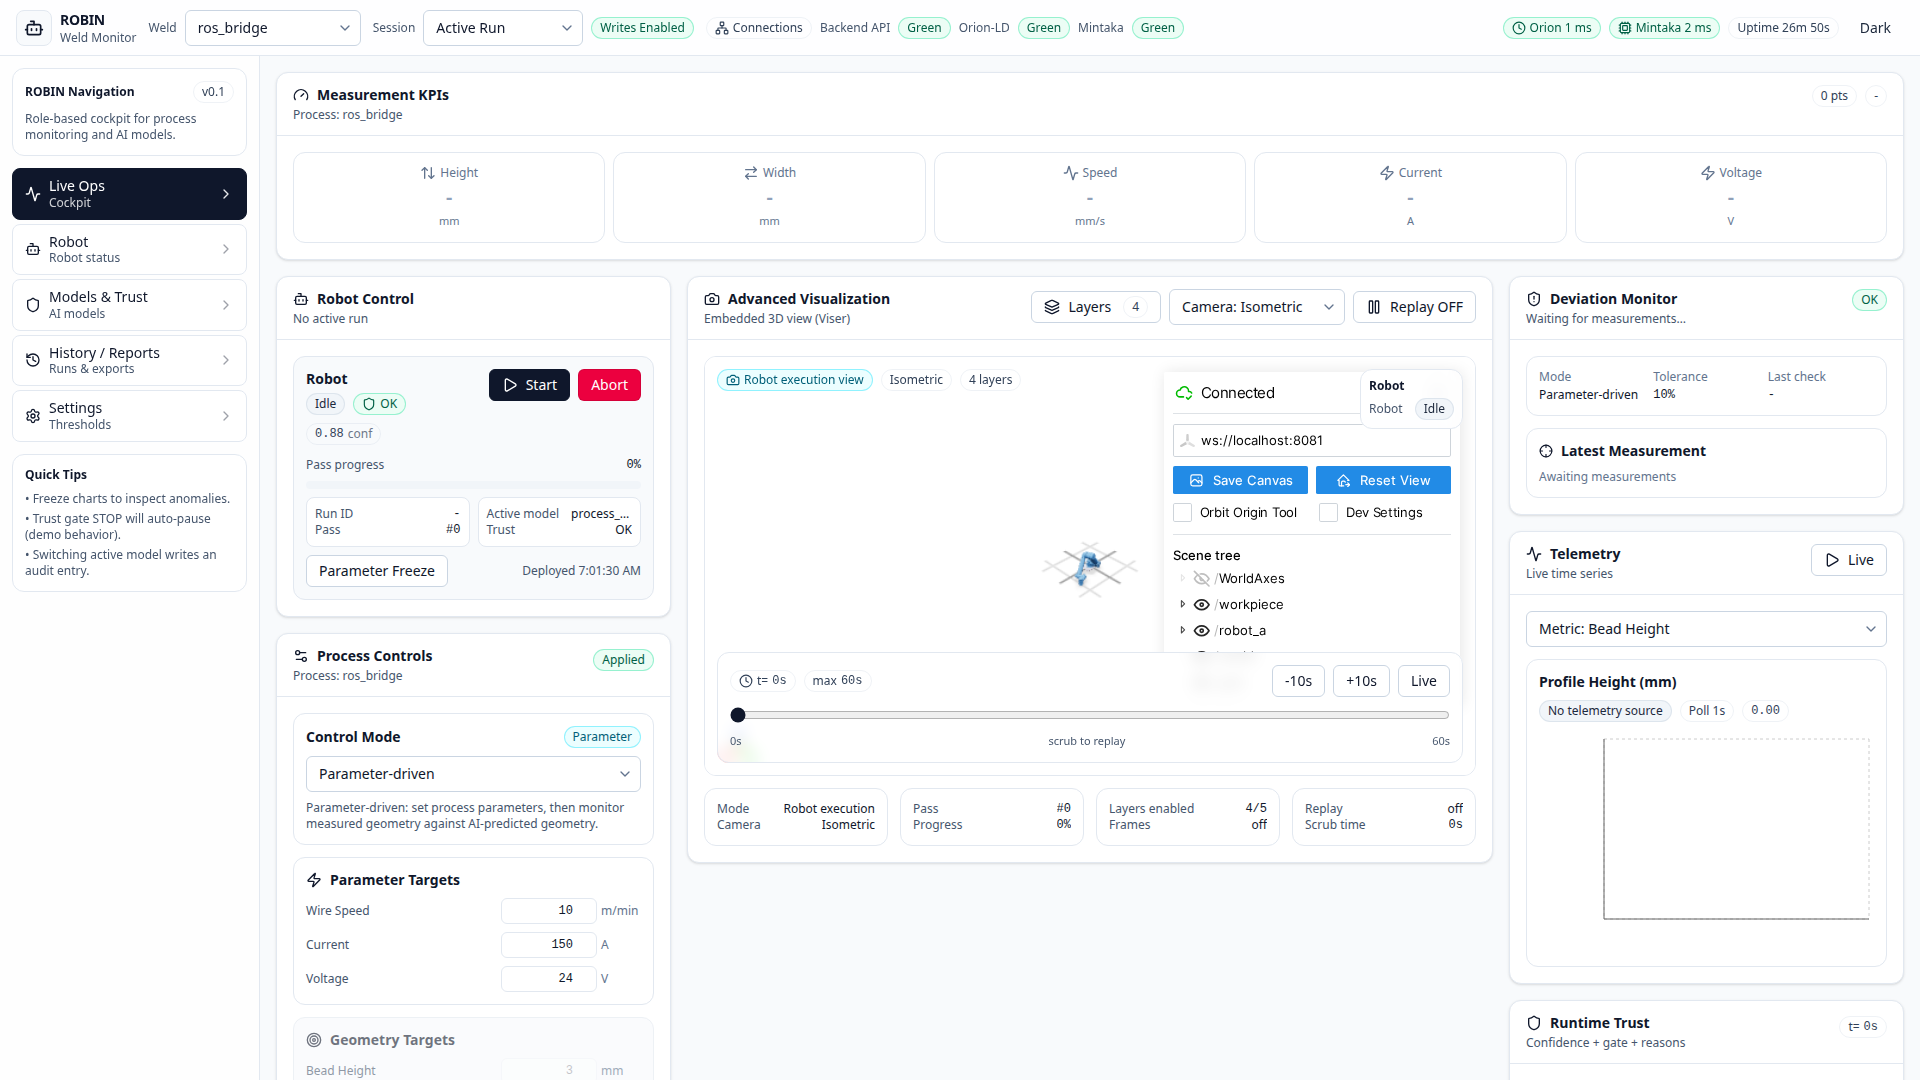
The Live Ops tab is the main cockpit.

Measurement KPIs
The top row shows the latest geometry values plus the primary profile-defined process parameters. For the welding profile, this means bead height, bead width, wire feed speed, travel speed, and arc length correction. Labels and units adapt automatically to the active profile, and auxiliary telemetry such as current or voltage can still be displayed when available.
Robot Control
The left panel provides per-robot controls:
Start / Pause / Resume / Abort - manage robot state
Parameter Freeze - lock current parameters so the AI cannot override them
Active Model - which AI checkpoint is loaded for this position
Trust Score - runtime confidence with OK / Warning / Stop gate
3D Visualisation
The centre panel embeds a Viser viewer (when a Viser server is running) with toggleable layers:
Robot model
Tool path
Workpiece
Profile segments
Coordinate frames
Camera presets (Isometric, Top, Front, Side) and a timeline scrubber are available below the viewport.
Deviation Monitor
The right panel compares measured geometry against the AI prediction (parameter-driven mode) or AI-guided geometry reference (geometry-driven mode):
Mode - shows the active operation mode
Tolerance - configurable percentage threshold
Latest Measurement - last received height and width
Source - shows whether the expected geometry comes from AI prediction or target fallback
Recommended actions when a deviation fires: manual adjust, request new AI recommendation, add data for fine-tuning, or start a new DOE
Process Controls
Below the deviation monitor, the Process Controls panel lets the operator:
Switch between parameter-driven and geometry-driven modes
Set tolerance percentage
Enter the active profile’s AI input values or target geometry (height, width) depending on mode. For the welding profile, the AI inputs are wire feed speed, travel speed, and arc length correction.
In geometry-driven mode, clicking Apply Settings stores target geometry and fetches AI-suggested parameters for the process
Telemetry Charts
The bottom section shows live time-series powered by Recharts:
Select metric: height, width, speed, current, or voltage
Data source badge shows whether data is coming from Mintaka stored data or fallback source
Poll cadence is 1-2 seconds depending on session mode
X-axis uses elapsed time from measurement timestamps (stored temporal data)
Live toggle for auto-scrolling and Freeze Charts to inspect windows
Models & Trust
The Models & Trust tab manages AI model checkpoints and trust settings.
See AI Models & Trust for a detailed walkthrough.
Other Tabs
Tab |
Purpose |
|---|---|
Robots |
Per-robot detail cards with individual telemetry and controls |
History / Reports |
Download CSV with all raw telemetry rows and persisted warning events (including raw JSON payload per row) |
Settings |
Dark mode, trust thresholds, chart freeze, connection status |
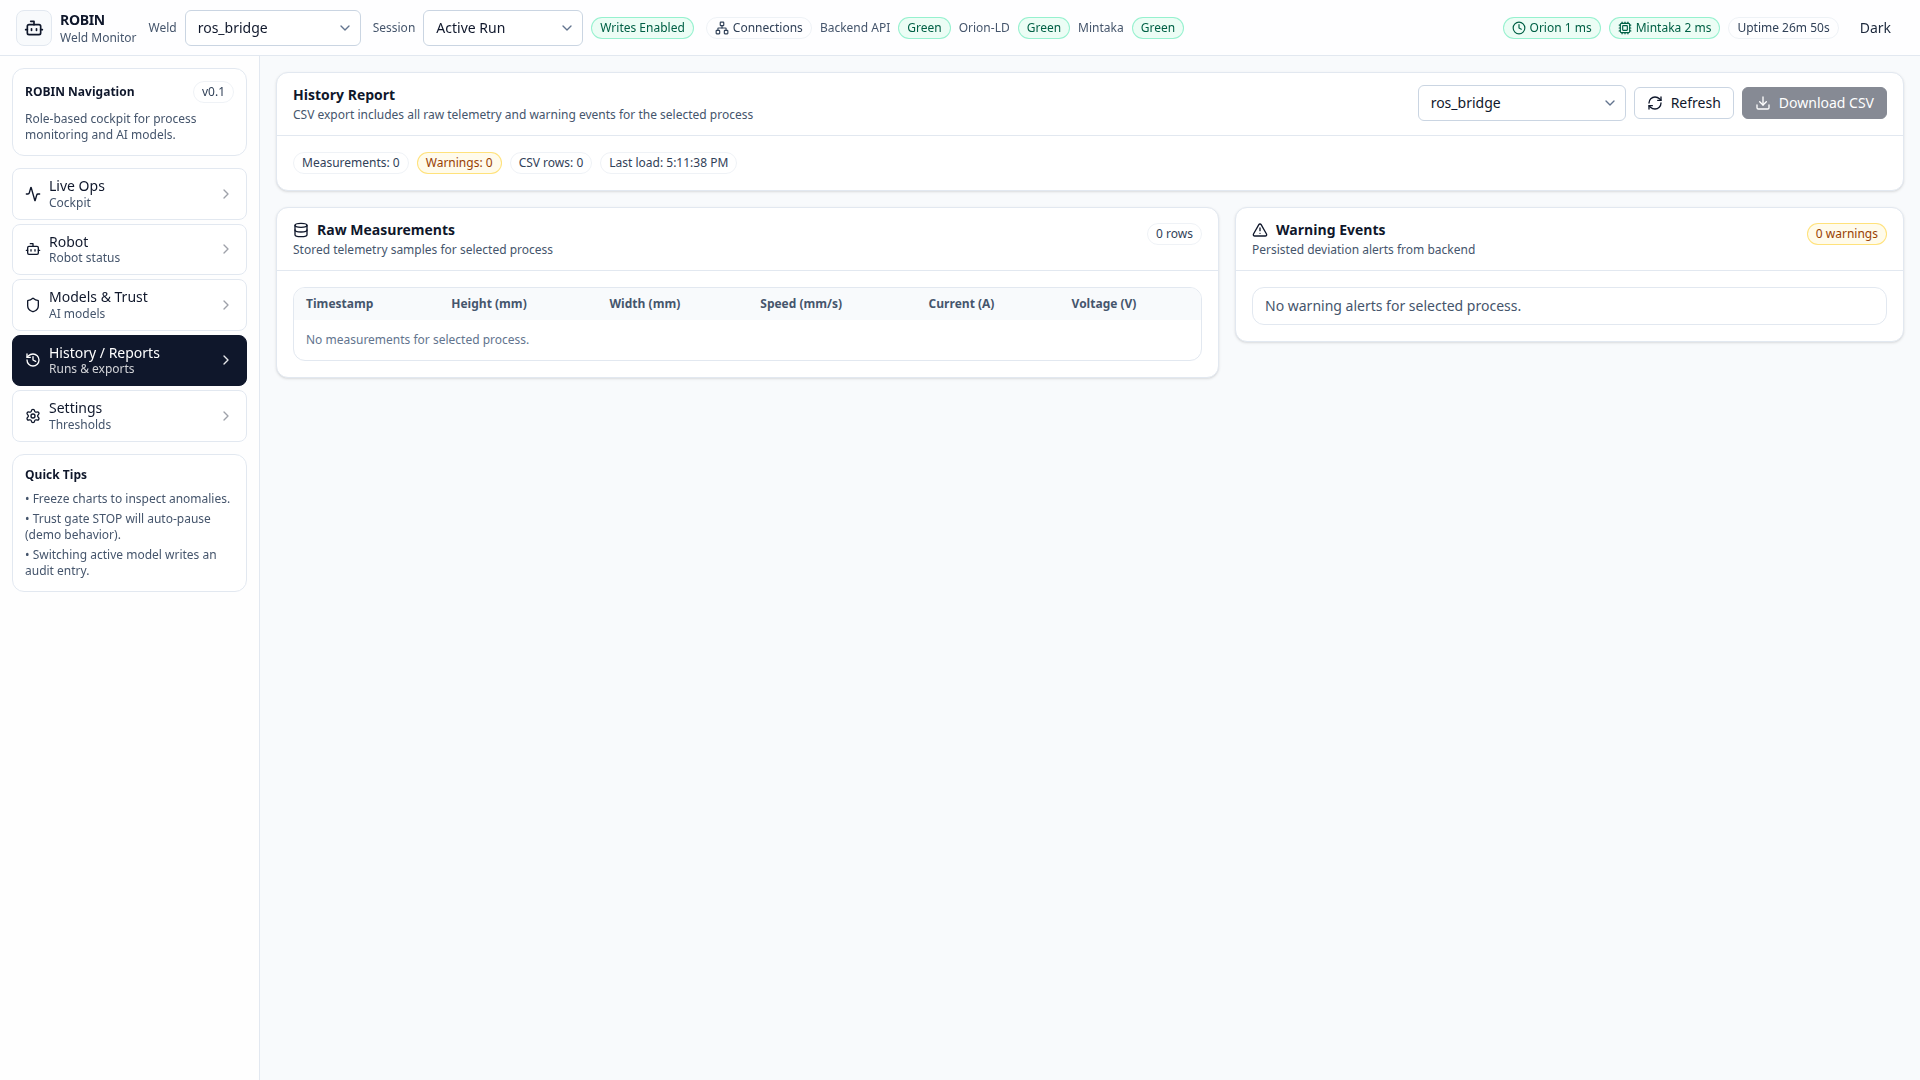
History CSV Workflow
Open History / Reports.
Select the process ID in the dropdown.
Click Refresh to pull current stored telemetry + warnings.
Click Download CSV.
Verify CSV content: *
record_type=measurementrows are raw telemetry samples. *record_type=warningrows are persisted deviation alerts. *raw_payload_jsonstores the exact backend payload for each row.
Top Bar
The top bar (visible on every tab) provides:
Process selector - switch between active processes
Session mode - Active Run / Demo Mode * Active Run: process-control actions write to backend * Demo Mode: process-control actions are simulated locally (no backend write)
Connection indicators - Backend API, Orion-LD, Mintaka from live
GET /healthprobes (green / yellow / red)Service latency chips - Orion and Mintaka round-trip times in milliseconds
Backend uptime - service uptime in hours from the Alert Engine health API
Dark mode toggle