Quick Start Guide
This page is the shortest no-hardware path from a clean clone to a working ROBIN run. It validates the FIWARE data layer, Process Intelligence API, and ROBIN Dashboard without requiring UR10e, Fronius, WAGO, Garmo, the MIL cell network, private datasets, proprietary credentials, ROS 2 runtime validation, or the physical demonstrator setup.
For the richer simulated scenario with live dashboard charts, Start-button control, deviation windows, alerts, and history checks, continue with Demo Scripts & Simulations after this hello world passes.
What This Hello World Validates
By the end of this page you will have:
a hardware-neutral FIWARE stack running in Docker
the Process Intelligence API responding with
"healthy"one demo process created
one mock measurement ingested into FIWARE
the measurement read back through the API
the ROBIN Dashboard able to display the demo process
one AI-assisted prediction/recommendation generated from mock inputs
        graph LR
    REVIEWER["Reviewer shell"] --> CLI["ROBIN CLI<br/>inside API container"]
    CLI --> ORION["Orion-LD<br/>NGSI-LD"]
    ORION --> MINTAKA["Mintaka<br/>history API"]
    API["Process Intelligence API"] --> ORION
    API --> MINTAKA
    DASH["ROBIN Dashboard"] --> API
    REVIEWER --> API
    REVIEWER --> DASH
Prerequisites
Docker and Docker Compose installed and running
curl for API checks
jq for readable JSON output
Python and Poetry are not required for this hello world because the ROBIN CLI is
executed inside the robin-alert-processor container.
See Installation Guide for full setup instructions.
Step 1 - Start the No-Hardware Services
The hello world uses the bundled welding profile because the included model
artifact and input feature names are defined by that profile. The command sets
ROBIN_PROFILE=welding explicitly so a local .env file or shell variable
does not accidentally switch profiles.
Linux:
ROBIN_PROFILE=welding docker compose up -d \
    orion-ld mongo-db timescaledb mintaka alert-processor robin-dashboard
macOS/Docker Desktop:
ROBIN_PROFILE=welding docker compose \
    -f docker-compose.yaml \
    -f docker-compose.macos.override.yaml \
    up -d \
    orion-ld mongo-db timescaledb mintaka alert-processor robin-dashboard
Wait for the API health check:
until curl -fsS http://localhost:8001/health | jq -e '.status == "healthy"' >/dev/null; do
    sleep 2
done
curl -s http://localhost:8001/health | jq '.status'
Expected output:
"healthy"
Step 2 - Create a Demo Process
Use a unique process id so the command remains rerunnable even if previous demo data was not cleaned up:
export PROCESS_ID="reviewer-hello-$(date +%s)"
docker exec robin-alert-processor \
    python -m robin create-process "$PROCESS_ID" --mode parameter_driven
Expected output contains the generated process id:
Created process: reviewer-hello-... (mode: parameter_driven)
Step 3 - Ingest One Mock Measurement
Add one mock geometry measurement with the input parameters expected by the bundled welding profile model:
docker exec robin-alert-processor \
    python -m robin add-measurement "$PROCESS_ID" "${PROCESS_ID}-m001" \
    4.9 7.2 \
    --speed 10.5 \
    --current 120 \
    --voltage 18.4 \
    --input-param wire_feed_speed_mpm_model_input=10.0 \
    --input-param travel_speed_mps_model_input=0.020 \
    --input-param arc_length_correction_mm_model_input=0.0
Expected output contains:
Added measurement reviewer-hello-...-m001 for process reviewer-hello-...: 4.9x7.2mm
Step 4 - Read the Measurement Back
Read the measurement through the Process Intelligence API:
curl -s "http://localhost:8001/process/${PROCESS_ID}/measurements?last=5" \
    | jq '{status, count, source: .debug_info.source, first: .measurements[0]}'
Expected result:
statusissuccesscountis at least1sourceismintaka,orion, ortroefirstcontains the mock geometry values4.9and7.2
Step 5 - Request an AI-Assisted Prediction
Call the AI recommendation endpoint with the same mock process inputs:
curl -s -X POST http://localhost:8001/ai-recommendation \
    -H "Content-Type: application/json" \
    -d "{
      \"process_id\": \"${PROCESS_ID}\",
      \"mode\": \"parameter_driven\",
      \"input_params\": {
        \"wire_feed_speed_mpm_model_input\": 10.0,
        \"travel_speed_mps_model_input\": 0.020,
        \"arc_length_correction_mm_model_input\": 0.0
      }
    }" | jq '{status, mode: .recommendation.mode, prediction: .recommendation.predicted_geometry}'
Expected result:
statusissuccessmodeisparameter_drivenpredictioncontains predicted geometry values
Step 6 - Check the Dashboard
Open http://localhost:5174, select the generated reviewer-hello-... process
from the process selector, and confirm the dashboard can display the created
process and measurement.
This hello world does not exercise the richer Start-button simulation, live 3D visualization, or injected deviation windows. Those are covered by Demo Scripts & Simulations.
Bundled Basic Demo Evidence
The repository includes a captured no-hardware basic demo evidence packet with commands, expected outputs, and screenshots:
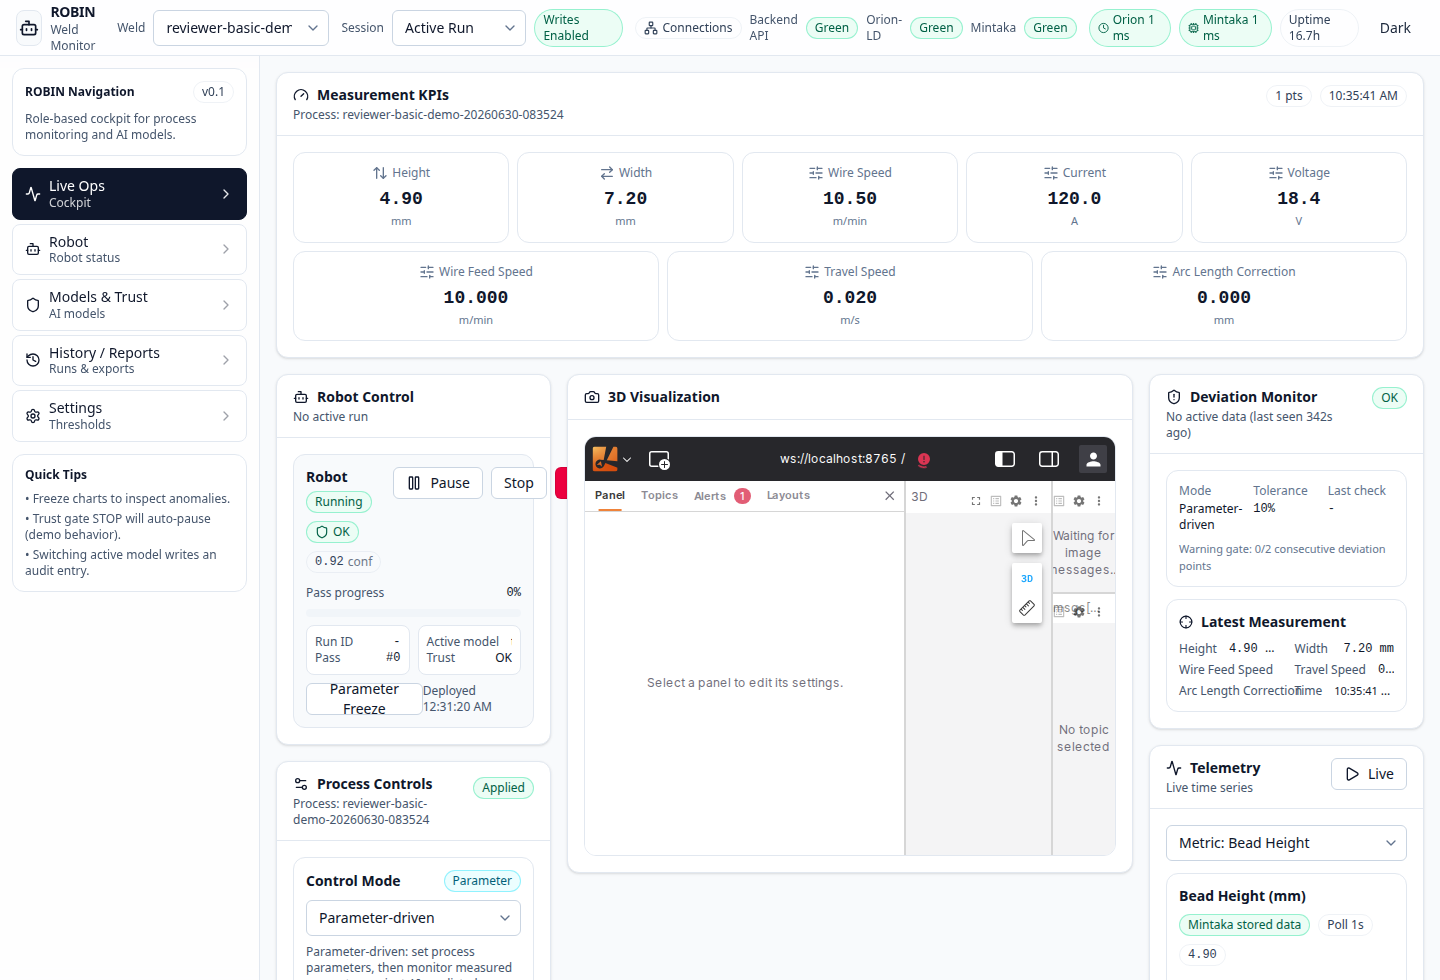
Basic no-hardware demo in the dashboard after one mock measurement was ingested and read back through the API.
Success Criteria
The hello world passes when:
/healthreturns"healthy"the
reviewer-hello-...process is createdone mock measurement is ingested
the API returns the measurement
the dashboard can display the process
the AI recommendation endpoint returns a prediction
Cleanup
To remove only entities created for this hello world without stopping the stack:
ID_PATTERN=".*${PROCESS_ID}.*"
curl -sG "http://localhost:1026/ngsi-ld/v1/entities" \
    --data-urlencode "idPattern=${ID_PATTERN}" \
    --data-urlencode "limit=1000" \
    | jq -r '.[].id' \
    | while read -r ENTITY_ID; do
        curl -s -o /dev/null -X DELETE "http://localhost:1026/ngsi-ld/v1/entities/${ENTITY_ID}"
done
Or stop the stack and remove local Docker volumes:
docker compose down -v
Use the same -f docker-compose.yaml -f docker-compose.macos.override.yaml
prefix for cleanup on macOS if you started the stack with the macOS override.
Next Steps
After the no-hardware hello world passes, run the basic simulated demo:
Demo Scripts & Simulations - live dashboard workflow, simulated telemetry, Start-button control, deviation checks, alerts, and history verification
Operator Dashboard - full walkthrough of every dashboard panel
REST API & Process Lifecycle - REST API exploration and process lifecycle management
AI Models & Trust - AI model management, training, and trust
Domain Profiles - switch domain profiles such as welding and spray coating